I’m designing a blood pressure monitor with a BT88X-series and I want to make a graph showing the blood pressure readings for each day of the week. How can I do it with EVE?
With EVE, you can design and customise your graph easily using the built-in graphics features. Here is one way to do it using the line strip feature.
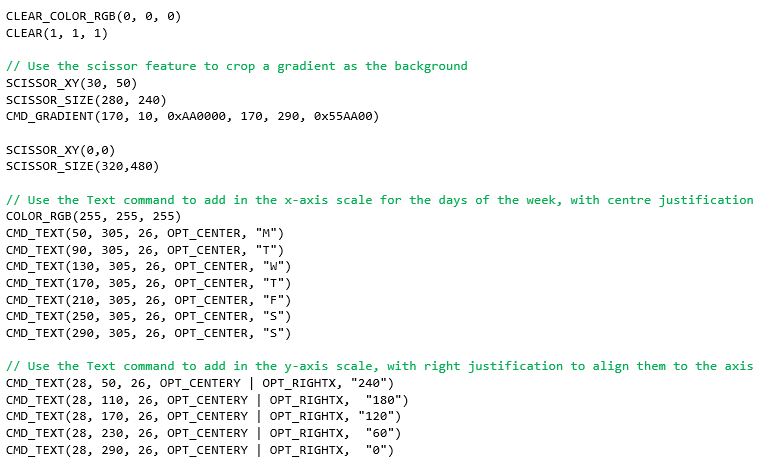
First of all, we draw the background using a gradient.
- The scissor functions allow the size to be set easily by limiting the gradient to a certain area of the screen.
- In this case, setting the chart height to 240 pixels matches nicely with the scale of the Y axis.
- You can find the list of commands used to draw the graph below Figure 2.
We can then draw the axes:
- Use the Text command to add labels for the X and Y axes.
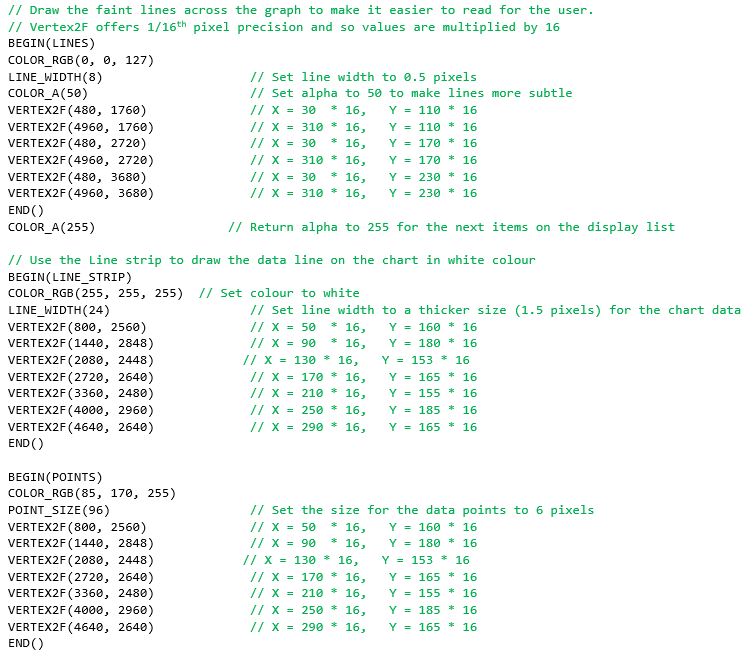
- We can also use the line feature to draw lines across corresponding to the Y axis labels.
We can now plot the data
- The Line Strip is an ideal solution as EVE will join the vertex points with a line.
- We have a vertex for each data point.
- The EVE Points feature can be used to place a point on each data value using the same coordinates as for the line strip.
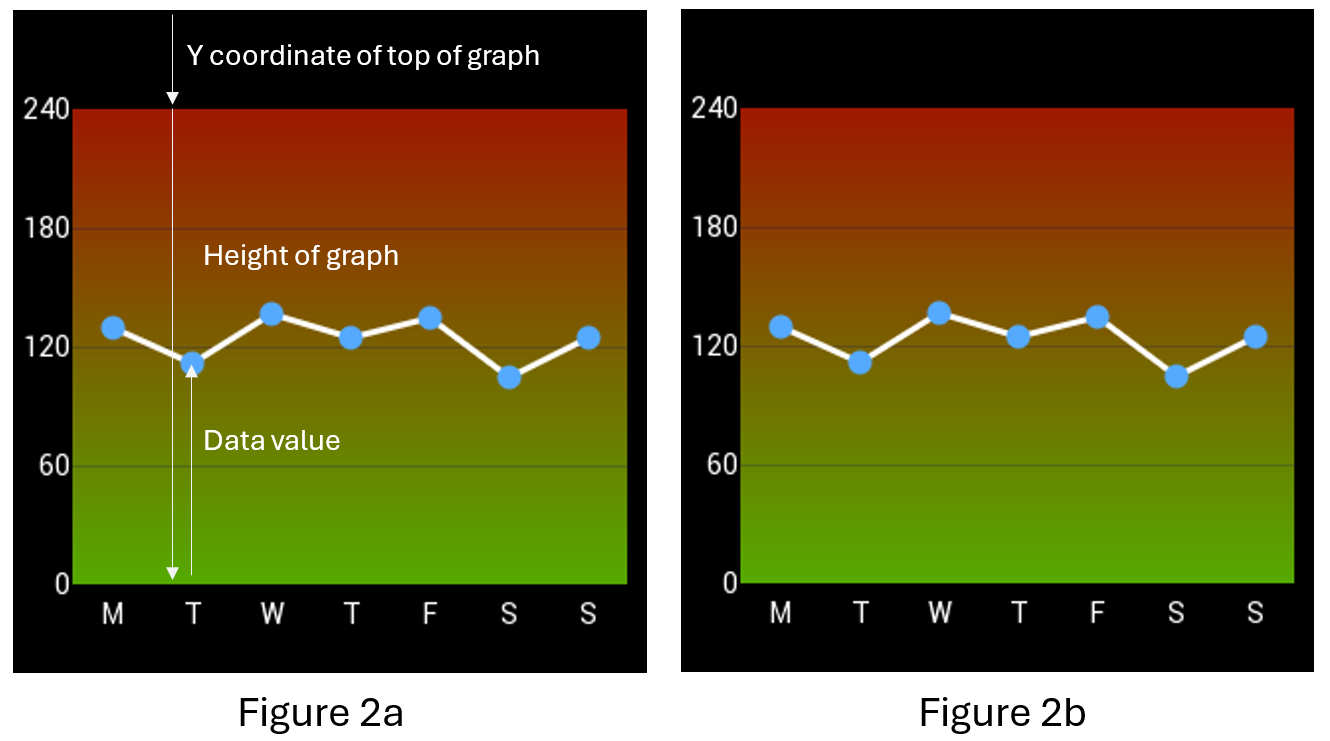
For this graph, the X values match the seven days labelled on the X axis. The Y coordinates for each point can be adjusted to reflect the data values.
Using Tuesday’s data point as an example, the Y value for the vertex command can be calculated as shown in Figure 2a
Note that EVE coordinates begin at (0,0) at the top-left of the screen and that we multiply by 16 as VERTEX2F coordinates have 1/16th pixel resolution.
Y coordinate = ( [Y coordinate of the top of the graph] + [Height of graph] – [Data Value] ) *16
= (50 + 240 – 110) * 16
= 180 * 16
The vertex instruction for the position on the screen is therefore VERTEX2F(90*16, 180*16)
The final graph is shown in Figure 2b
Here is the full list of commands used to draw the graph.
Why not try it out now using our EVE Screen Editor (ESE) tool?
Just download and install ESE using the link above, set the Device Type to BT880, BT881, BT882 or BT883 in the Project window, and paste the code below into the Coprocessor window at the bottom of ESE.